Predictions of future temperature trends
Predictions Based on Greenhouse-Warming Theory
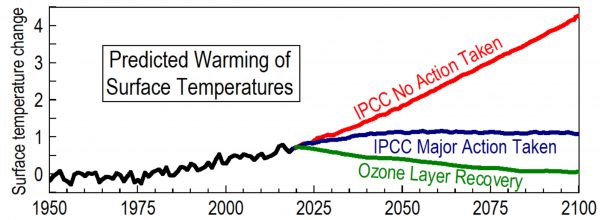
Greenhouse-warming theory predicts 3.5 degrees Celsius warming by 2100 if no action is taken to reduce greenhouse-gas emissions (red line). Ozone-depletion theory, on the other hand, predicts a gradual decline in temperatures as the ozone layer recovers to pre-1980 levels (green line).
The black line shows global average surface temperatures increasing just under 0.9 degrees Celsius from 1950 through 2019 based on the HadCRUT4 data analysis.
The red line shows an additional warming of 3.5 degrees by 2100 assuming there is little effort to reduce greenhouse-gas emissions. This prediction is described in detail in a report by the Intergovernmental Panel on Climate Change (IPCC) entitled Climate Change 2013: The Physical Science Basis. The 39 models evaluated and averaged to calculate this curve assume by the year 2100 that atmospheric concentrations of CO2 will be on the order of 935 parts per million, compared to 409 ppm in 2018, and that the total radiative forcing will be approximately 8.5 Wm-2.
The United Nations Emission Gap 2019 report agrees that if “climate action continues consistently throughout the twenty-first century, a continuation of current policies would lead to a global mean temperature rise of 3.5°C by 2100 (range of 3.4–3.9°C, 66 per cent probability). This corresponds roughly to a tripling of the current level of warming as assessed by the IPCC (2018).”
The navy-blue line shows an anticipated additional warming of only 0.4 degrees by 2100 assuming major action will be taken to reduce greenhouse-gas emissions. The 32 models evaluated and averaged to calculate this curve assume by the year 2100 that atmospheric concentrations of CO2 will be on the order of 421 parts per million and that the total radiative forcing will be approximately 2.6 Wm-2.
Warming of 0.9 degrees since 1950 has already resulted in substantial negative impacts. The threat of an additional 3.5 degrees of warming by 2100 has convinced most climate scientists, most scientific organizations, world leaders, and a majority of others that substantial action to reduce greenhouse-gas emissions must be taken immediately.
Yet all of these analyses are based on greenhouse-warming theory, which I have shown is not only mistaken, it does not even appear to be physically possible. Greenhouse-warming theory has never been demonstrated to be physically possible by experiment, a cornerstone of the scientific method. Furthermore, all of these analyses are based on calculating radiative forcing as a single number of watts per square meter, which I have shown cannot adequately represent the broad continuum of energies observed to be present in radiation. I see no evidence that these predicted warmings can physically happen. Greenhouse-warming theory is rapidly becoming the most expensive mistake ever made in the history of science—economically, politically, and environmentally.
Predictions Based on Ozone-Depletion Theory
The green line above is based on the ozone-depletion theory of global warming described in detail in this video, in this paper, and on this website. Ozone-depletion theory explains the observed physics of global warming in detail. Planck’s empirical law shows that the only way to warm a body of matter by radiation is by absorbing radiation containing higher amplitudes of oscillation at every frequency of oscillation and especially at the highest frequencies. These frequencies and amplitudes of oscillation are the result of oscillation of all the bonds holding matter together. Ultraviolet-B radiation is the highest frequency, highest energy, solar radiation reaching Earth. The ozone layer protects life on Earth by absorbing most ultraviolet-B solar radiation. When the ozone layer is depleted, it absorbs less ultraviolet-B, so more ultraviolet-B with high amplitudes of oscillation reaches Earth, where it warms air most efficiently by dissociating ground-level ozone pollution and where it increases your risk of sunburn, cataracts, and skin cancer.
It turns out that humans, unwittingly, carried out the most definitive experiment ever done linking global warming to concentrations of gases in the atmosphere. In the 1960s, humans began manufacturing and releasing chlorofluorocarbon gases (CFCs) that were cheaper and safer to use than alternatives for spray-can propellants, refrigerants, solvents, and foam-blowing agents. Around 1970, as atmospheric concentrations of CFCs were increasing substantially, ozone depletion began to increase, and global temperatures began to increase. Warming of approximately 0.6 oC stopped increasing in 1998 after the United Nations passed the Montreal Protocol mandating significant cutbacks in CFC production. Humans appear to have started the warming by manufacturing CFCs and then to have stopped the increase in warming by stopping production of CFCs. This was the most definitive experiment ever done linking global warming to concentrations of gases in the atmosphere.
Humans appear to have started the warming by manufacturing CFCs and then to have stopped the warming by stopping production of CFCs. This was the most definitive experiment ever done linking global warming to concentrations of gases in the atmosphere.
I explain in this talk at the annual meeting of the American Meteorological Society how, without the Montreal Protocol, global temperatures today would probably be a half degree warmer. Three atmospheric chemists received the 1995 Nobel Prize in Chemistry for “for their work in atmospheric chemistry, particularly concerning the formation and decomposition of ozone.”
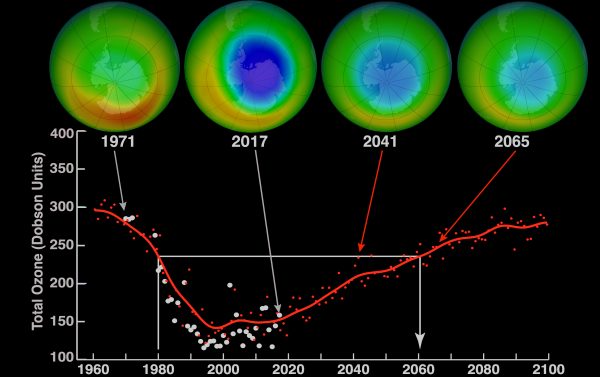
October average minimum ozone over Antarctica observed from 1960 to 2017 and projected to 2100 based on models.
CFCs became very popular because they are highly inert. They do not react with most substances until they reach the upper stratosphere where they are broken down by solar ultraviolet-C radiation. Atmospheric chemists calculate that it may take until 2075 for atmospheric concentrations of CFCs to return to pre-1980 levels. This figure from NASA shows the annual average minimum value of ozone over Antarctica each October (white dots) and modeled values (red dots). The red curve shows a smoothed version of the red dots. This red curve from 2019 to 2100 has been inverted and scaled to become the green curve at the top of this web page labeled Ozone Layer Recovery.
The ozone-depletion theory of global warming predicts, to first order, that annual average global mean temperature is inversely proportional to the optical thickness of the ozone layer— is inversely proportional to annual average global mean concentrations of ozone. Ward (2016) shows that “a decrease in yearly total column ozone at mid-latitudes of the northern hemisphere by 30 Dobson Units (DU) corresponds to a 0.9 oC increase in temperature anomaly in the northern hemisphere.” If ozone depletion is the primary cause for observed warming, then the world should not get warmer unless ozone-depletion increases. The exact shape of the green line will be affected by the amounts of CFCs produced illegally and by how large volumes of CFCs currently in old refrigerators, freezers, and air conditioners are ultimately disposed of.
The ozone-depletion theory of global warming predicts, to first order, that annual average global mean temperature is inversely proportional to the optical thickness of the ozone layer. If ozone depletion is the primary cause for observed warming, then the world should not get warmer unless ozone-depletion increases.
There was very sudden warming of 0.3 oC from 2014 to 2016 at more than three times the rate of warming observed from 1970 to 1998, making 2016 the hottest year on record. This appears to have been caused by ozone depletion related to the eruption of Bárðarbunga volcano in central Iceland, the largest basaltic eruption since 1784. Lava from this eruption covered 85 km2 of land within 6 months from late August 2014 to late February 2015 (182 days).
There was cooling in 2017 and 2018, but slight warming in 2019 apparently due to the Lower Puna eruption in Hawaii covering 35 km2 of land from late May 2019 to early August (96 days). The rate of eruption per day was unusually high for Hawaii and was similar to the Bárðarbunga eruption, but only erupting 41% as much lava in 53% of the time.
We still have a lot to learn about the precise chemical path for how large basaltic eruptions deplete the ozone layer and how this changes as a function of latitude of the volcano. But basalts emit an order of magnitude more chlorine and bromine than major explosive volcanoes. Plus the lava flowing out onto Earth’s surface is much hotter, leading to more effective convection of gases up through the troposphere. Basalts erupt at temperatures from about 1000 oC to 1200 oC (1832 oF to 2192 oF). Andesitic magma, typically erupted by explosive volcanic eruptions above subduction zones, has temperatures that range from 800 oC to 1000 oC (1472 oF to 1832 oF). Rhyolitic magma, typical where granites are formed, has temperatures in the range of 650 oC to 800 oC (1202 oF to 1472 oF).
The ozone-depletion theory of global warming predicts over the next 55 years that annual, average, global temperatures should continue to decrease slowly as the ozone layer recovers. Basaltic lava eruptions large enough to change this trend are highly unlikely and even if they occur, temperatures typically return to normal within a few years after the eruption ends.
The ozone-depletion theory of global warming predicts over the next 55 years that annual, average, global temperatures should continue to decrease slowly as the ozone layer recovers. Basaltic lava eruptions large enough to change this trend are highly unlikely and even if they occur, temperatures typically return to normal within a few years after the eruption ends.
Postdictions
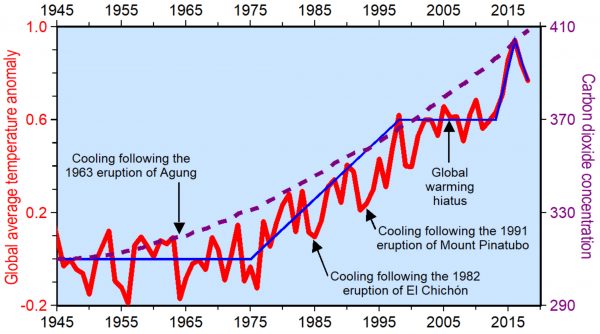
Annual average global temperatures (red line) remained relatively constant from 1945 to 1975 and from 1998 to 2013 even though concentrations of carbon dioxide (dashed purple line) continued to increase at ever increasing rates.
While the trend in atmospheric concentrations of greenhouse gases has risen steadily at ever increasing rates since 1945 (dashed purple line), the trend in annual average global surface temperatures (red line) increased significantly only from 1970 to 1998 and from 2014 to 2016—thirty-one out of the past seventy-four years, a mere 40% of the time. There is no direct causal relationship between steadily increasing concentrations of greenhouse gases and intermittently increasing surface temperatures.
This problem first became obvious during the global warming hiatus from 1998 through 2013—fifteen years when temperatures changed very little if at all. As the years passed by, dozens of peer-reviewed papers argued that there was no hiatus or that the hiatus was caused by internal climate variability, increased anthropogenic aerosols, changes in the El Niño-Southern Oscillation or other ocean oscillations, surface wind variability, changing ocean heat vertical distribution, increased radiation to space, a prolonged solar minimum, coverage bias in the observations, intensifying trade winds, systematic deficiencies in some of the post-2000 external forcings used in the model simulations, etc. Extensive waving of arms and grasping at straws. There is a noticeable lack of peer-reviewed papers wondering if the hiatus implies that greenhouse-warming theory might be mistaken even though that was the fear of many of these authors.
There are many other situations throughout Earth history where the linkage between greenhouse-gas concentrations and surface temperatures does not appear to be direct. Climate scientists typically argue: the climate system is complex, there are many complex feedbacks, this must be normal statistical variation, etc. Reading thousands of peer-reviewed papers published in recent years, I get the impression that the essence of human beings is not their ability to reason but their ability to rationalize. How can our observations be consistent with the well-established and widely-accepted greenhouse-warming theory?
Ozone depletion theory, on the other hand, appears to explain observed changes in temperature directly and in considerable detail. For example:
-
-
- Why global temperatures rose very little between 1945 and 1970, because there was little change in the ozone layer.
- Why global temperatures rose 0.6 oC from 1970 to 1998, because of increasing ozone depletion due to manufacture of CFCs.
- Why the rise in global temperatures stopped around 1998, because the Montreal Protocol stopped the increase in CFCs and the resulting increase in ozone depletion.
- Why temperatures rose very little between 1998 and 2013, because there were no major changes in the depleted ozone layer.
- Why temperatures suddenly increased 0.3 oC from 2014 to 2016 at more than three-times the rate from 1970 to 1998, because of the eruption of Bárðarbunga, the largest basaltic lava flow since 1784, causing ozone depletion.
- Why 2016 is the hottest year on record and 2017, 2018, and it looks like 2019 were all cooler, because of the eruption of Bárðarbunga.
- Why 2019 was warmer than 2018, because of the lower Puna eruption of basalts in Hawaii in early 2019, which was just under half the size of the Bárðarbunga eruption.
- Why ocean heat content has continued to rise substantially, because continuing ozone depletion is letting more ultraviolet-B radiation reach Earth where it penetrates oceans hundreds of meters, being completely absorbed well below the surface where the energy cannot radiate back into the air at night.
- Why glaciers are continuing to melt at an alarming rate, because ozone depletion allows more ultraviolet radiation to sublimate snow and ice, in addition to warmer air.
- Why warming is greatest in polar regions where ozone depletion is greatest.
- How the stratosphere forms a blanket around Earth keeping Earth 30 to 35 degrees warmer that expected for a planet at Earth’s distance from Sun. The increase in temperature from the tropopause to the stratopause varies daily in the range of 30 to 35 degrees.
- Why air temperatures are raised very efficiently as ultraviolet-B radiation not absorbed in the ozone layer, dissociates ground-level ozone pollution.
- Why ozone depletion leads to dissociation of ground-level ozone pollution causing most of the urban heat-island effect.
- Why the northern hemisphere had twice the warming of the southern hemisphere, because 90% of humans live in the northern hemisphere so that most ground-level ozone pollution is there.
- How the stratosphere is heated by solar ultraviolet radiation causing dissociation of oxygen, ozone, carbon dioxide, etc. and how infrared radiation emitted by Earth does not have enough energy to cause heating of air by dissociation.
- Why the biggest changes in oceans are in the Southern Oceans within the Antarctic ozone hole.
- Why the biggest changes in land temperature are on the Antarctic Peninsula within the northern extremes of the Antarctic ozone hole.
- Why the greatest warming is of minimum temperatures during the winter, when ozone is most depleted.
- Why the footprints of climate change in ice cores document rapid warming within years, followed by slow cooling over millennia in sequences that are highly erratic, but average a few thousand years in length.
- Why warmings throughout Earth history occurred suddenly and why some are much, much larger than others, causing nearly all the major mass extinctions in Earth history.
- Why the Paleocene/Eocene thermal maximum 55.5 million years ago was contemporaneous with the onset of rifting between Greenland and Norway.
- Why the largest known basaltic lava fields were contemporaneous with major warming when North America and Africa began rifting apart 201 million years ago.
- And numerous other observations throughout Earth history.
- Why surface temperatures on Venus are 462 oC, because carbon dioxide, making up 96% of the gases in Venus’s atmosphere, is dissociated by solar ultraviolet-C radiation much like oxygen in Earth’s stratosphere.
How successful must a theory be before scientists are willing to begin to examine it carefully?
-
Stay Connected